

Using artificial intelligence, we uncovered insights from nearly 3,500 rows of marketing data in minutes.
Over the years we’ve spent experimenting with AI, we found that many AI-powered tools can be combined with other data sources and solutions to save time and surface fresh insights.
One way to do that is to pull data from Buzzsumo, a content marketing intelligence tool, and analyze it with IBM Watson Analytics, an AI platform.
Buzzsumo excels at providing large datasets on websites and content pages. Watson is great at finding insights from data. Together, we hypothesized they could be a powerful team for marketers who want to learn more about their content and the competition’s.
To see how this would play out, we analyzed three top marketing blogs—Kissmetrics, Marketing Land and Copyblogger—using these two tools.
Method Behind the Madness
Buzzsumo is an online tool that shows you the top shared content by source for any keyword phrase. The tool also allows you to compare content performance between sites.
We plugged in the URL of each of our three marketing blogs. Buzzsumo emailed us a spreadsheet with the title of each post, its URL, number of social shares by platform, authors, word counts and number of linking domains.
[Note, we used a Buzzsumo Pro account license to access and export the full datasets.]
We ran this data over the last 12 months. Once we had the data set, we uploaded it into
IBM Watson Analytics, an AI-powered tool that analyzes large datasets, and gives you the ability to run explorations and predictions. Admittedly, there’s a bit of a learning curve with IBM Watson Analytics, but once you get the hang of it you can create visualizations in seconds.
The result was a visualization dashboard that compared everything from which site had the most shared content to which author published the most on each site. We hand-picked the information we found most interesting, and published it below.
As you’ll see, AI made it far easier to uncover insights fast—and even highlighted some relationships in the data that we might have missed.
The Top Insights Uncovered
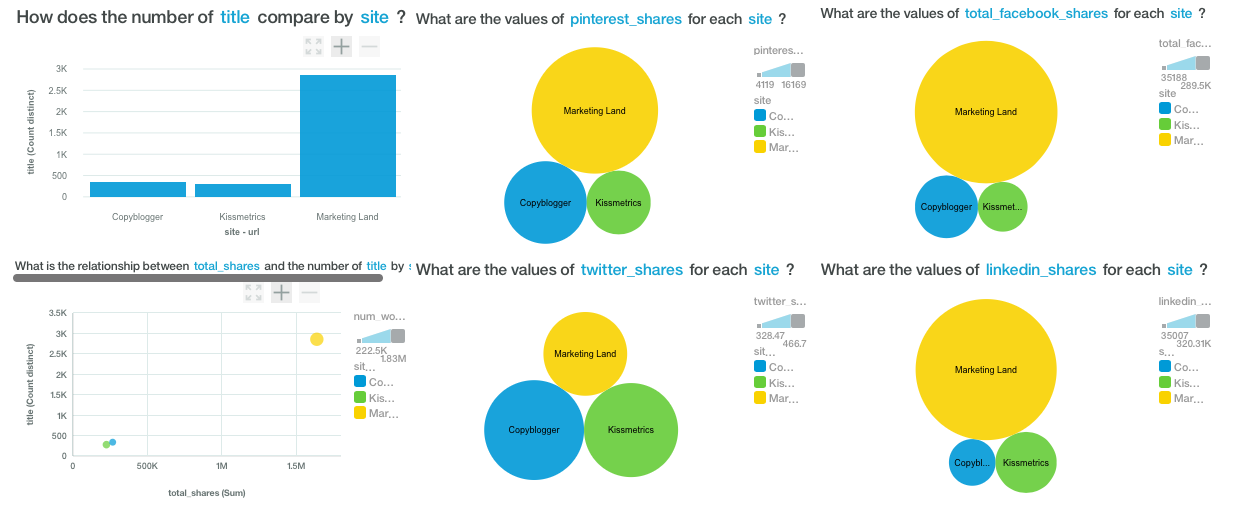
Right out of the gate, we can quickly identify which site’s content is most shared.

Importantly, we can see that Marketing Land’s content has racked up the most shares across platforms by a significant margin.
We can then run comparisons of how sharing stacked up by channel.

It’s no surprise, given how many shares the site has, that Marketing Land has the competition beat soundly when it comes to sharing on Facebook.
It also looks like Marketing Land leads by a wide margin on LinkedIn, too.

Yet when it comes to Twitter, the disparity between shares drops significantly.

We can use the data to gain clues as to why this might be the case.
When we compare the number of blog titles published per site, we immediately see that Marketing Land published far more than the other two sites, and saw a corresponding lead in total shares.

That volume of content also earned Marketing Land far more links.

Diving deeper into Marketing Land’s data, Watson can tell us which authors got the most total shares for their content over the past year. (Looks like Tim Peterson (@petersontee), Amy Gesenhues (@amygesenhues) and Barry Levine (@xBarryLevine) are driving tons of traffic for the site.)

We can also see which month the site’s content was shared most on specific channels like Facebook. It looks like August was the most popular by a wide margin.

The same goes for Twitter and LinkedIn shares, which also had big months in August.


Marketing Land might use this data to determine what promotional tactics work best by isolating when the most shares occurred. Competing sites might do the same to determine how Marketing Land is securing so many shares.
This is just scratching the surface of what’s possible when you marry Buzzsumo and IBM Watson Analytics data.
To try this out for yourself, use Buzzsumo here and then import your data into IBM Watson Analytics.
In the meantime, we’ll share more experiments with Buzzsumo and IBM Watson Analytics data, as well as with other marketing AI tools.
Don’t miss a post: subscribe to the Marketing AI Institute today.
